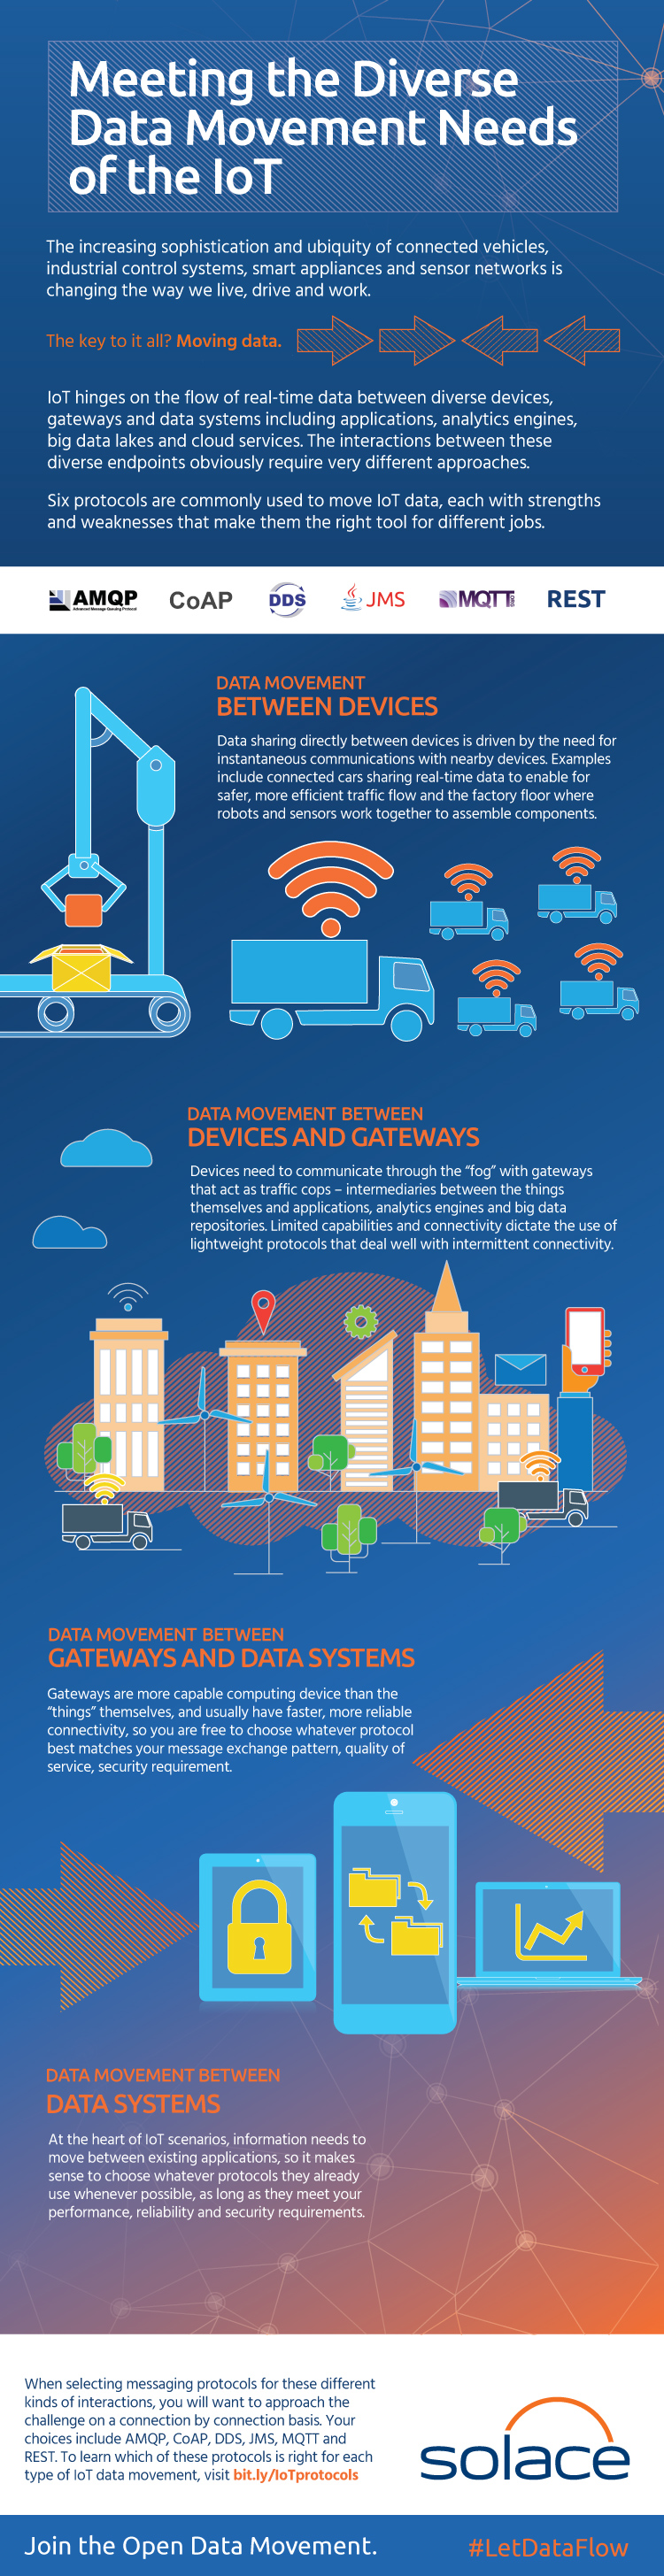
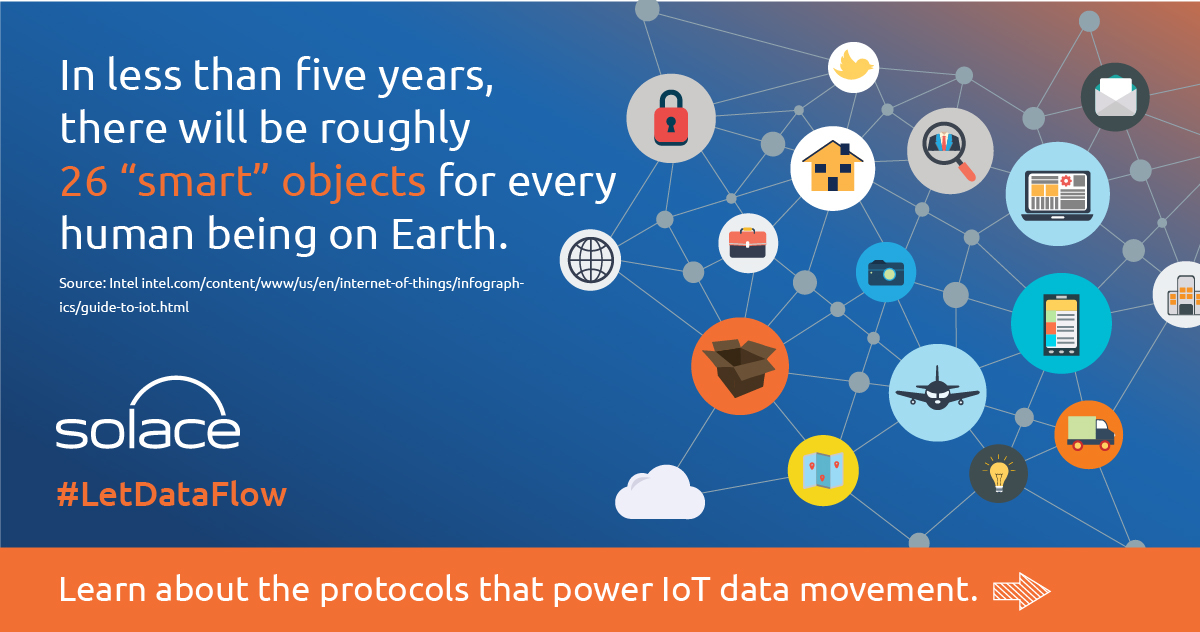
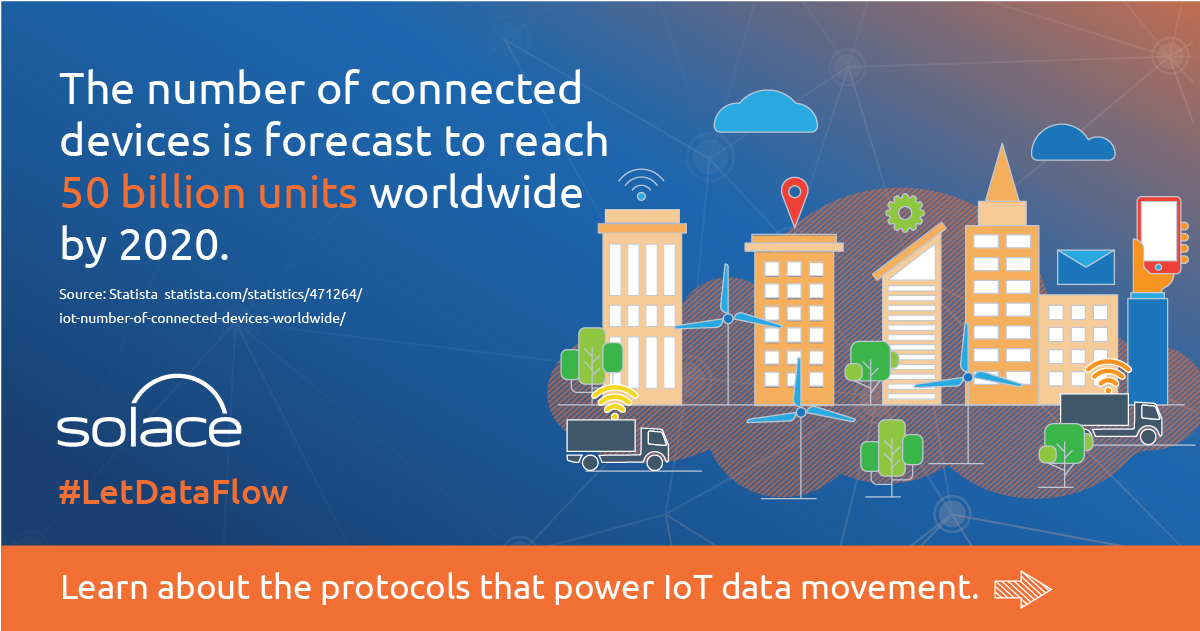
Solace an open data movement provider, was in need of an infographic displaying the effects of meeting the diverse data movement needs of the internet of things. To support the infographic they also wanted to launch a social media campaign that tied into the theme of the infographic with more general factoids about IoT that I call "infomemes".
STEP ONE: INFOGRAPHIC CONTENT
I started with a word doc that outlined the text content in the infographic and supplied stats for the infomemes. Visually the client supplied their logo, six brand colors and a circular/wave graphic that didn't make it in the final infographic.
STEP TWO: INFOGRAPHIC LAYOUT AND INSPIRATION
Having clients like IBM and Cisco, I was already familiar working with the internet of things and could start to visualize iconography vehicles and devices to help tell the story that the client was wanting to convey. I expanded my thoughts into online research looking specifically at IoT and big data and started building my infographic concepts.
“These are AMAZING. I can’t wait to show the client!!! Thank you lady, you rock!!”
CLIENT PRESENTATION ONE


“The graphics are consumer, personal, smarthome. Should be more industrial, commercial, smart city level. ”
STEP THREE: INCORPORATE CLIENT FEEDBACK
Not a huge loss, but back to the drawing board on a few of the graphics. Some of the client's target audiences were being left out. I had made assumptions about what was hot in IoT and that did not translate directly to Solace. I proceeded to look more closely into their products. Along with the change to the graphics the client edited some of the text and wanted to introduce protocols to the top section, featuring logos that helped the layout of the graphics. These were the final options presented and selected by the client.